

2020 SAS, R, or Python Survey Results: Which Tool do Data Scientists & Analytics Pros Prefer?
Each year for the past seven years, we’ve asked data scientists and analytics professionals whether they prefer to use SAS, R, or Python and examined their responses to see how tool preferences vary by a variety of factors.What began as a comparison just between SAS and R users in 2014 and 2015, the debate became even more spirited when Python was added to the mix in 2016 and 2017, culminating surprisingly in a nearly perfect tie between all three competitors in our 2018 survey results. Then, in 2019, Python pulled into the lead.Would Python continue its upward trend in 2020? What other insights would we find? With over 1,000 votes tallied, this post has our overall analysis, but you can see additional details in our deeper dive video.
For comparison purposes, we only ask one question: Which do you prefer to use – SAS, R, or Python?
And the overall 2020 winner is… Python!
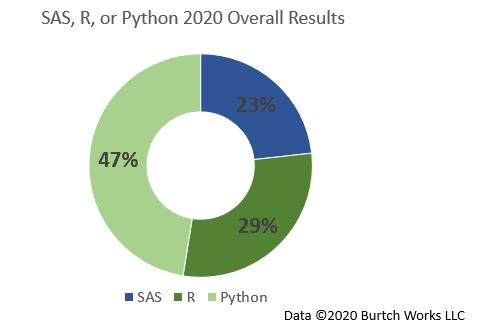
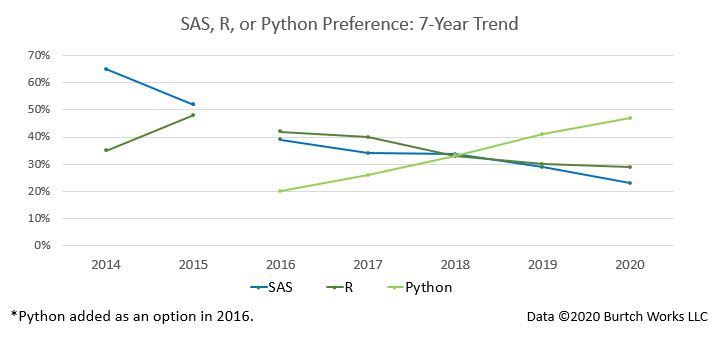
In 2014 and 2015 we examined SAS vs. R preferences, adding Python in 2016 due to popular demand. Since then Python has more than doubled from 20% in 2016, to 47% of the votes in 2020. In 2018 all three tools were neck-and-neck, but last year Python pulled ahead. In nearly every segment we analyzed this year, we continued to see support for Python is increasing.
SAS, R, or Python Preferences Examined by Demographic Factors
Each year we also combine participant responses with demographic information to show how respondent preferences vary by factors like region, industry, years of experience, education, and data scientists vs. other predictive analytics professionals.
Years’ Experience
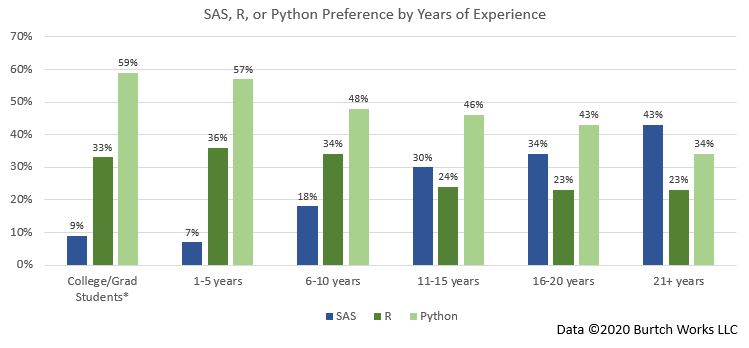
As you can see, support for Python is very high among those at the early career level with 5 or less years’ experience, and support for SAS is highest among professionals with 21+ years’ experience. Once again this year, we also surveyed a sample of students in our network to keep track of trends at the university level.*College/graduate students shows the preferences of Bachelor’s, Master’s, and PhD students, the majority of whom are (or will be) in the graduating class of 2019-2022. For those who have already graduated, they were counted as students if they are still in internships, completing post-graduate work, or are newly-graduated and not yet employed in a data science or analytics position. Because they are not yet employed in the field, these students are excluded from the other samples (overall results, industry, region, etc.).Note: Since Burtch Works is a recruiting firm, we do not ask professionals for their age. However, we do know their years of quantitative work experience, which is highly correlated with age, and takes into account how many years since they first entered the analytics or data science fields (this might be after university, or, for those who changed careers, when they transitioned into their data science or analytics career).
Education
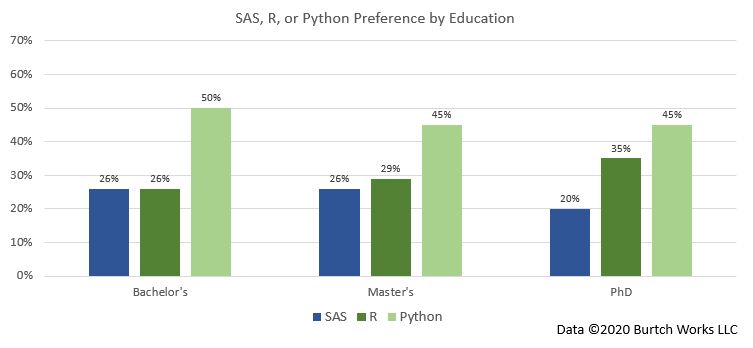
While PhD holders have consistently favored open source tools like R and Python due to their use in academic research settings, last year Python took the lead among Bachelor’s and Master’s degree holders as well, where SAS still held a slight lead in 2018. Now we can see that while Python leads for all groups, the rest of the Bachelor’s and Master’s degree sample is fairly evenly split between R and SAS. Support for R is also highest among PhD holders.
Area of Study
A new factor that we added to our analysis last year was the area of study for the respondent’s highest degree earned, which we also showcase in our salary reports, and this has revealed some very interesting tool preference trends.
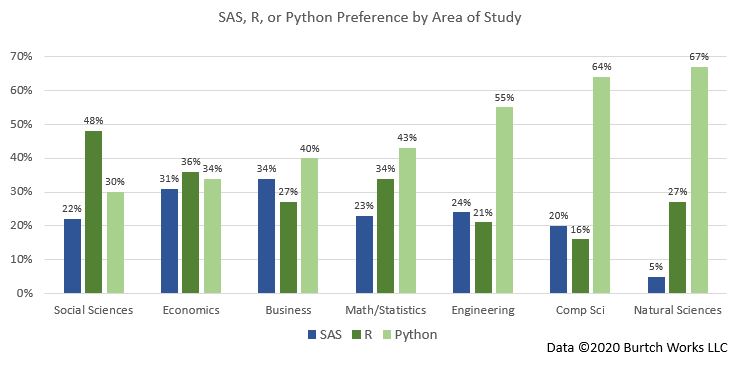
Those in the Social Sciences showed the strongest preference for R. Professionals whose area of study was Engineering, Computer Science, and Natural Sciences all overwhelmingly preferred Python. Support for SAS was strongest among Business degree holders, although Python still leads overall in that segment.In our recent salary study, we noted that data scientists whose main focus is analyzing unstructured or streaming data are far more likely than other predictive analytics professionals to come from a computer science, engineering, or natural science educational background.
Region
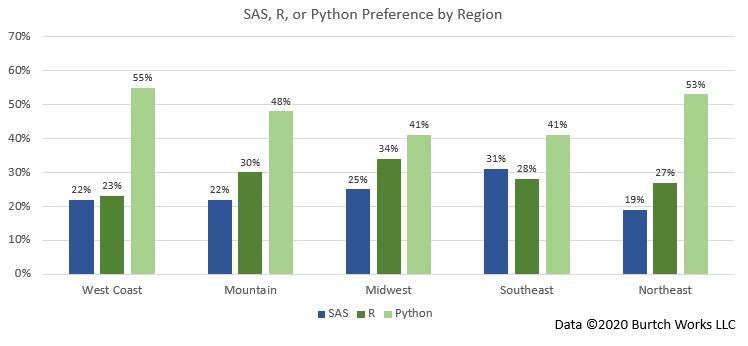
This year, Python continues to lead in every region that we examined, and was highest on the West Coast. Python has also continued to gain in both the Midwest and Southeast, where SAS had held the lead in 2018, but was slightly overtaken last year.
Industry
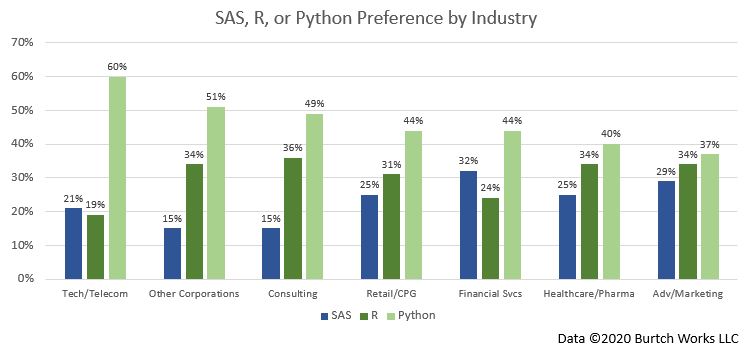
As you can see here, Python leads in every industry segment we analyzed.Consistent with previous years, Python votes were the highest at Tech/Telecom firms. Last year, for the first time, Python managed to pull ahead of SAS in both the Financial Services and Healthcare/Pharmaceutical sectors, and we see it continuing to gain ground in 2020.In Financial Services, Python has been gaining substantially since 2016, catapulting from 15% of the vote in 2016 to 44% in 2020. This shift in tool preferences comes as more financial services firms are supporting open source tools like R and Python or at least allowing them. We’ve also seen several major financial services employers, which began to transition away from SAS a few years ago, complete their transition to open source tools in recent years.
Comparing Data Scientists to other Predictive Analytics Professionals
While Burtch Works has always regarded data scientists as a specialized subset of predictive analytics professionals, we usually separate data scientists and predictive analytics professionals in our salary reports and other analyses to compare the two groups. This is primarily because of differences in skillsets that results in differing salary bands, but, as we pointed out in our recent salary report, there are a number of demographic distinctions between the two groups as well (such as common areas of study or industries of employment).As we’ve defined them, data scientists work primarily with unstructured or streaming data whereas others predictive analytics professionals mostly focus on structured data. Although the two areas are becoming more blended as of late, and the rest of this post combines the two groups, we thought it might be interesting to show how their tool preferences differ.
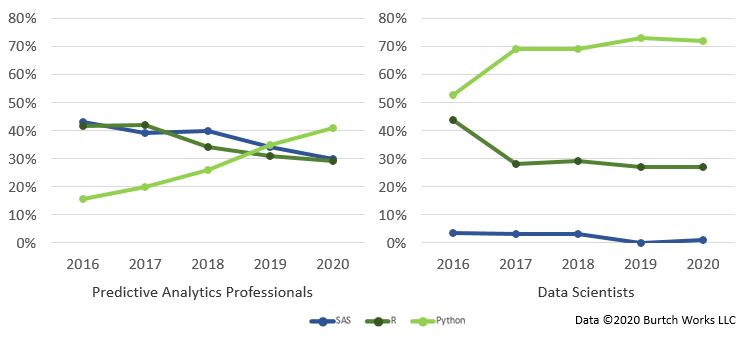
Here you can see the 5-year trend for both predictive analytics professionals on the left, and data scientists on the right.Data scientists have always favored open source tools, especially Python, with SAS receiving no votes among this group in 2019. Data scientists are the segment with the starkest contrast between tools, and over 70% of them favor Python.Among predictive analytics professionals that primarily focus on structured data, tool preferences were more mixed, but Python managed to get ahead of SAS in 2019, and continued to climb a bit further ahead in 2020 as well.
So which tool should you learn?
As you can probably guess, there is no one-size-fits-all answer. While SAS is still used by some more traditional teams, including some in Financial Services and Pharmaceuticals, many are now allowing support for and even transitioning to open source options like R and Python, and this shift is likely to continue.The best thing you can do is to take a look at the job descriptions for the industries or companies where you think you might want to work and see what they’re looking for. Regardless of which tool you learn, if you only know one tool your options may be limited. The more tools you’re familiar with, the more adaptable you can be, and since this industry is constantly evolving, it’s important to keep learning new tools in order to keep your skills up-to-date with the market.There are a lot of online resources such as Coursera, Udacity, Kaggle, and much more where you can learn new tools and practice applying your skills. The more you can demonstrate your abilities with different tools, the more marketable you’ll be when you’re looking for a job.