

2018 SAS, R, or Python Survey Results: Which do Data Scientists & Analytics Pros Prefer?
The results of our 2019 SAS, R, or Python survey have been released! Click here to see our latest analysis.
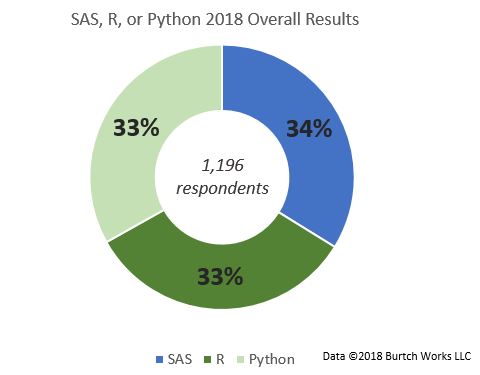
For the past five years we’ve been surveying our network of data scientists and analytics professionals to determine which tool they prefer to use – SAS, R, or Python.Our most popular annual flash survey began as a battle between heavyweight SAS and up-and-comer R in 2014 and 2015, then we added Python as an option in 2016 and 2017 due to popular demand.This survey has always been immensely popular with over 1,000 responses every year, and 2018 was no different, climbing to our highest yet with nearly 1,200 respondents!
To keep things simple, we only ask one question: Which do you prefer to use – SAS, R, or Python?
What did we find? An exceptionally close race! Drumroll please…
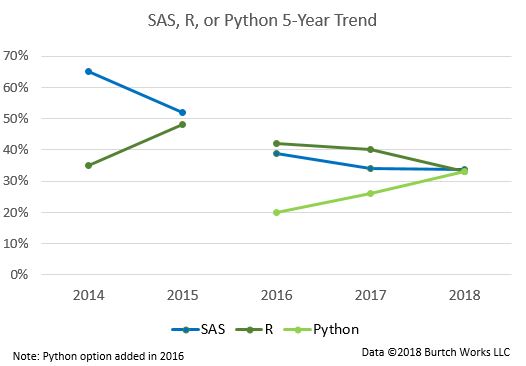
As you can see from the 5-year trend above, Python has been making strong gains since its inclusion in 2016, and this trend was noticeable in nearly every category that we track.We also matched responses to demographic information, so we’re able to show how respondent preferences vary by factors like region, industry, years of experience, education, and data scientists vs. other predictive analytics professionals.
SAS, R, or Python Preferences Examined by Demographic Factors
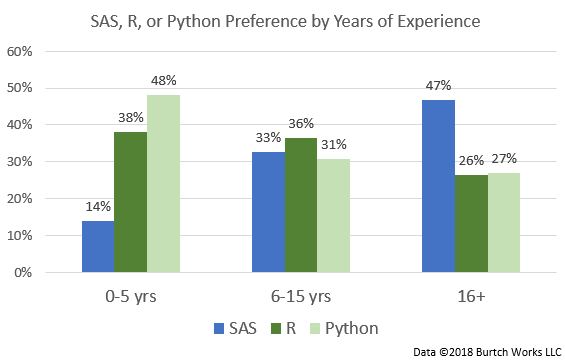
Open source tools like R and Python are overwhelmingly favored by professionals with 5 or less years’ experience. While SAS continues to see strong support among professionals with 16 or more years’ experience, Python made noticeable gains here as well. Those with 6-15 years’ experience slightly favor R, but levels of support are within 5 percentage points among all the tools.Note: Since Burtch Works is a recruiting firm, we do not ask the age of the professionals that we work with. However, we do know their years of quantitative work experience, which is highly correlated with age, and takes into account how many years since they first entered the analytics or data science fields (this might be after university, or, for those who changed careers, when they switched into the field).
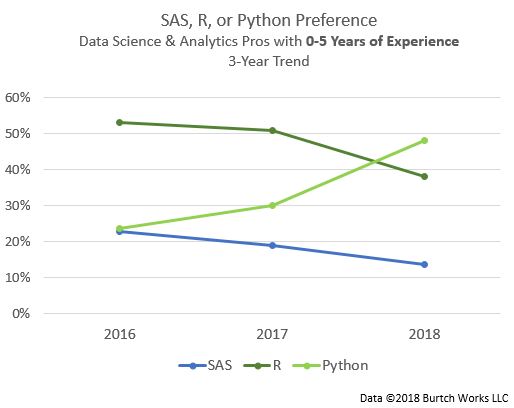
Shifts at the junior end can often be indicative of growing changes in the market, so this year we also looked at how preferences among those with 5 or less years’ experience have shifted over the past three years with Python in the mix.The data show that Python support among professionals with 5 or less years’ experience has doubled from 24% in 2016 to 48% in 2018. Support for both R and SAS has been declining for this group.
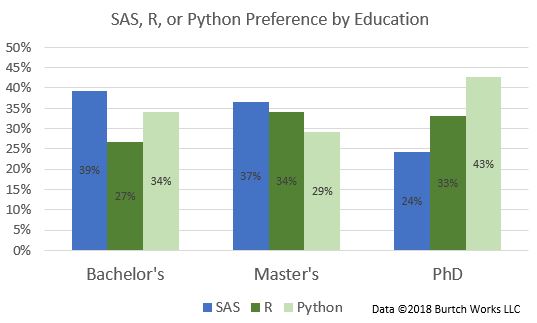
Bachelor’s and Master’s degree holders continue to show the strongest support for SAS, while PhD holders have consistently favored open source tools like R and increasingly Python. This may be due to many reasons, including the use of open source tools in research and academic settings, which establishes a tool preference that they carry with them into business careers, as well as the lack of licensing costs and the ease of putting Python models into production, among others.
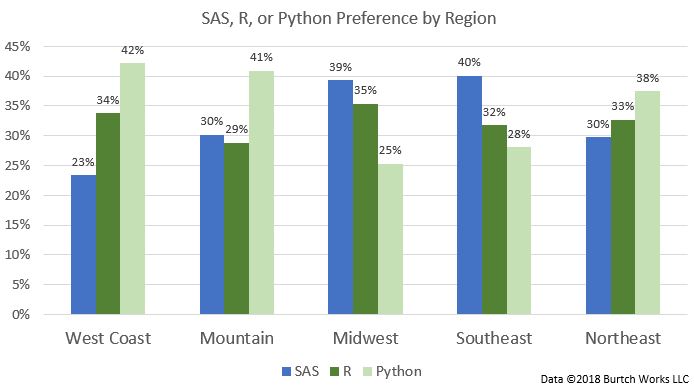
As with last year, the largest proportion of Python supporters are on the West Coast, with the Mountain region close behind. Same as in 2017, R support is strongest in the Midwest, and SAS is most dominant in the Southeast. Python gained support in every region when compared to our 2017 survey results.
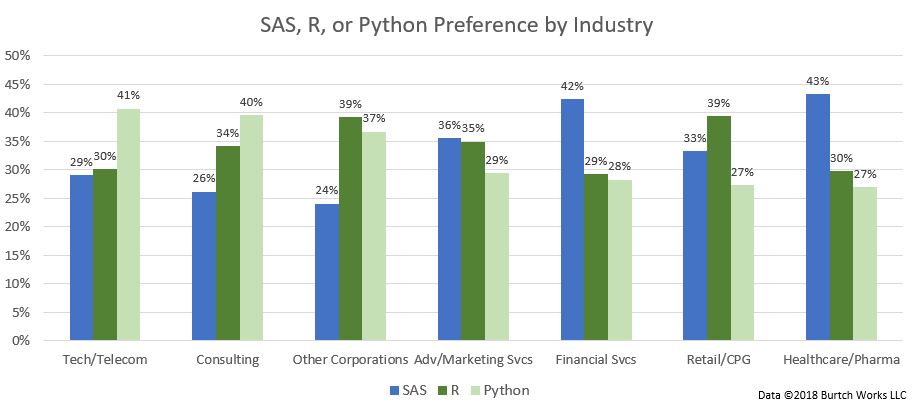
Python support continues to be highest at Tech/Telecom firms, while SAS maintains strongest in industries like Financial Services and Healthcare/Pharmaceuticals. R continues to see support in the Retail and CPG industries. As with the region breakdown, Python gained support in every industry.
Comparing SAS, R, or Python Preferences: Data Scientists vs. Traditional Predictive Analytics Professionals
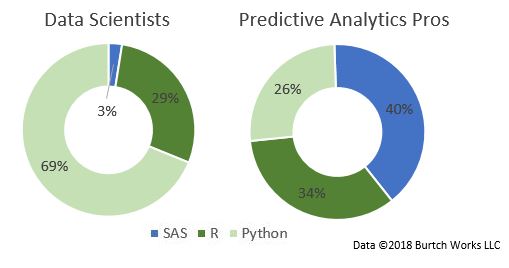
At Burtch Works, we separate data scientists from traditional predictive analytics professionals because of the differences in salary bands, tool usage, data volume and structure, and a variety of other factors. The main difference is that we define data scientists as those working primarily with unstructured or streaming data, while traditional predictive analytics professionals work primarily with structured data. You can read more about our definition of data scientists here.This distinction is important for our salary reports, but it also shows noticeable differences in tool preferences as well. Data scientists overwhelmingly prefer Python, while predictive analytics professionals working with structured data tend to prefer SAS or R.
A Few Lively Comments
Of course, one of our favorite aspects of running a survey that inspires such passionate responses is reading the comments, so we thought we’d share a few:(R = Python) > SASSAS. Python next on my list to get comfortable in.Here is my preference: Python > SAS > R.80% R; 20% Python; 0% SASSAS first, Python secondPython! 🐍RrrrrrrrSAS, but R for visuals.I prefer to use Python I am a recovering SAS programmerR (but truly, these days, whatever works!)SAS is the tool for me (banking).R of course :)I prefer Python for most data science work, but R for making visualizations.SAS by a nose over R.I prefer to use R for statistical analysis and then Python.Without any hesitation Python!If you’d like to see the full results from last year’s SAS, R, or Python flash survey, you can view the 2017 results here. You can also click here to see the results of our other flash surveys, including those on hiring demand, machine learning usage, and what motivates data scientists and analytics professionals change jobs.
Interested in our salary research on data scientists and predictive analytics professionals? Download our studies using the button below.
Click to download our free salary reports What did you think of this year’s results? If anything surprised you or you have any predictions you’d like to share, please feel free to leave a comment below!